
What Humans Can Actually Eat | Part II
A Three-Part Series Introducing Nutrition from First Principles
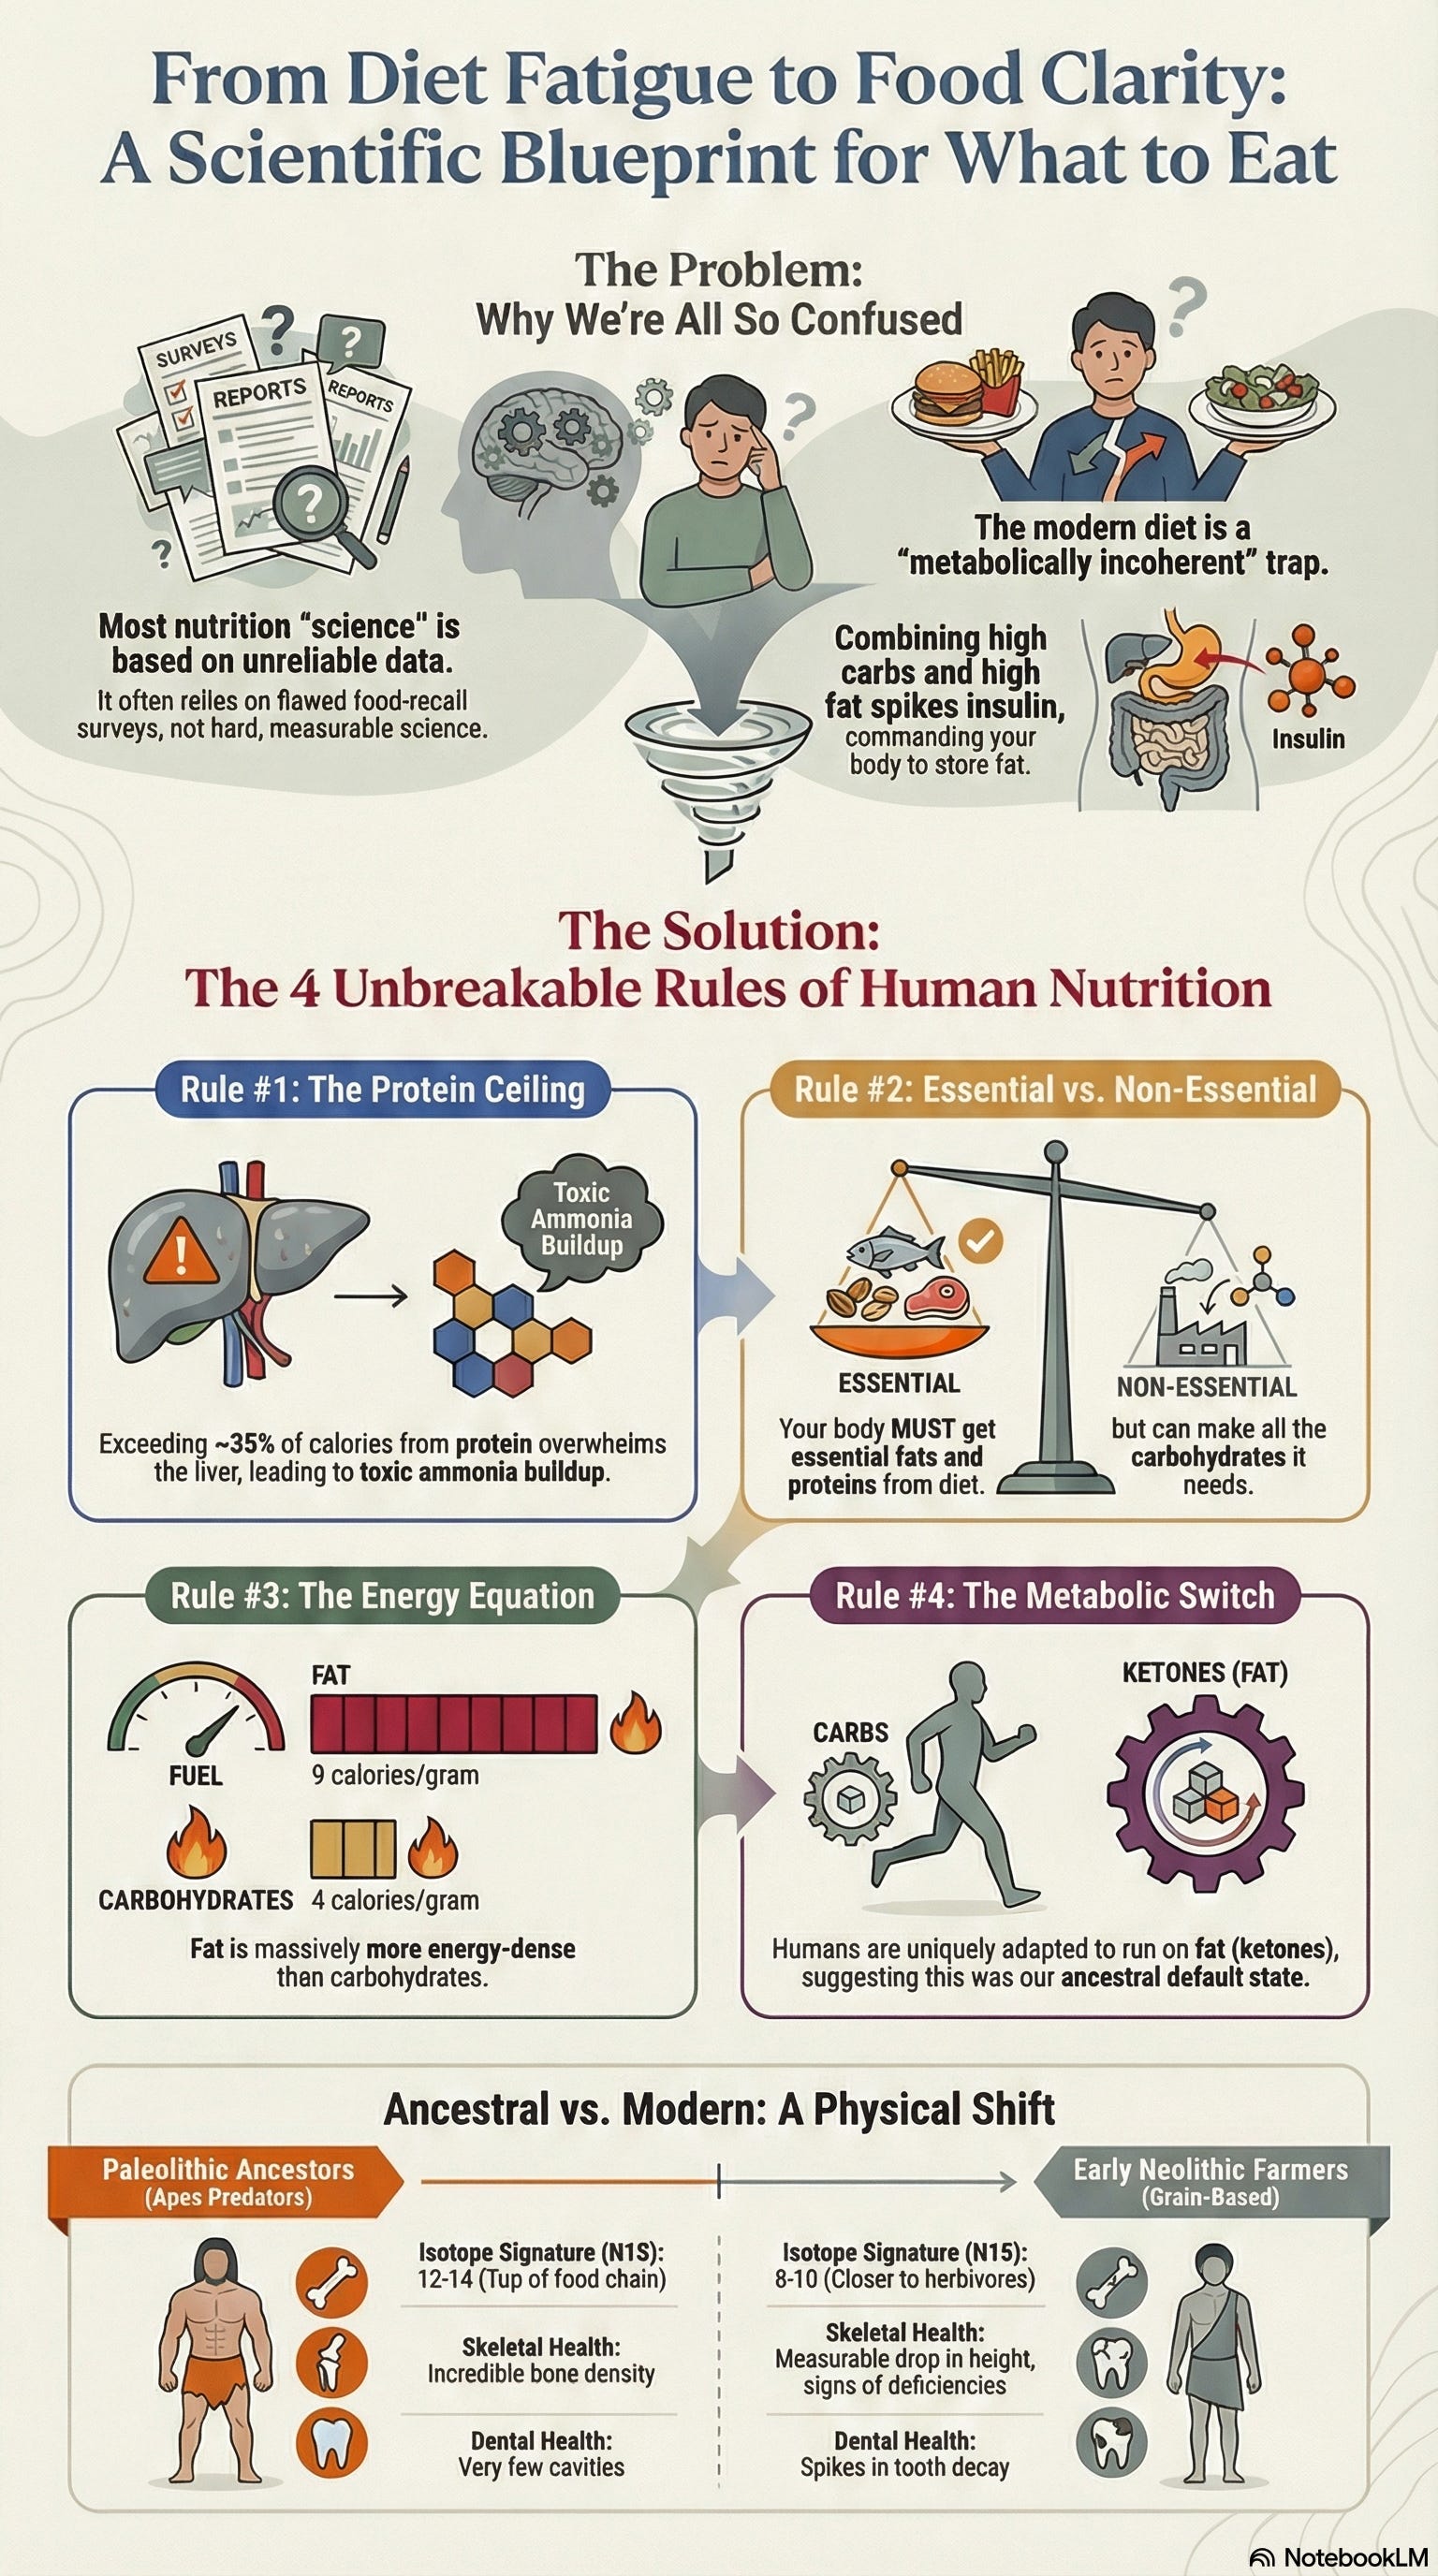
The protein ceiling operates in every human liver. Feed someone nothing but lean rabbit meat and within weeks, they die. Not from lack of calories. From ammonia accumulation the liver can’t clear fast enough.
This isn’t dietary philosophy. It’s biochemistry that doesn’t care what you believe about nutrition.
When observational studies contradict and experts disagree, start with what can’t be otherwise. Biochemical limits identical across all humans. Isotopic signatures in bones that can’t misreport their diet. Metabolic mechanisms measurable in any laboratory. These constraints narrow what humans can actually eat before any preference enters the picture.
Watch what emerges when we start from constraints.
Biochemical Limits
Some possibilities are mechanistically eliminated before any dietary preference enters the picture.
The Protein Ceiling
Feed someone nothing but lean rabbit meat. Within days, they develop headaches, diarrhea, nausea. Within weeks, they die. Not food poisoning or allergy. Protein toxicity, documented by Arctic explorers who called it “rabbit starvation.”
The mechanism is straightforward. Protein metabolism generates ammonia. The liver converts ammonia to urea for excretion. This system has capacity limits. Push beyond roughly 35–40% of calories from protein, and ammonia accumulates faster than the liver can clear it. The result is hyperammonemia, with symptoms ranging from discomfort to death.
Vilhjalmur Stefansson, who lived among the Inuit, described parties of men dying surrounded by fresh game, purely from eating too much lean meat. The Inuit themselves knew this. They prioritized fatty organs and discarded lean muscle for their dogs.
If your ancestors survived primarily on animal foods, they needed fat. Not as preference. As biochemical necessity.
This ceiling eliminates entire possibility spaces. No hunter-gatherer could thrive on 60% protein. No Paleolithic human could survive on lean game alone.
When isotopic data shows our ancestors at apex predator trophic levels, consuming large quantities of animal foods, we can deduce the macronutrient distribution without dietary records. High animal intake plus protein ceiling equals a fat-centric diet. The math isn’t optional.
Essential vs. Non-Essential
The body requires certain fatty acids it cannot synthesize: omega-3s like EPA and DHA, omega-6s like linoleic acid. Without dietary fat, you develop deficiency diseases. The body requires certain amino acids it cannot synthesize: the nine essential amino acids. Without dietary protein, you die.
But there is no such thing as an essential carbohydrate.
That statement contradicts decades of food pyramids and expert recommendations emphasizing grains as a dietary foundation. Yet it’s biochemically verifiable: the liver produces glucose through gluconeogenesis from protein and the glycerol backbone of fats. Every cell that requires glucose can be supplied without eating a single carbohydrate.
This doesn’t make carbohydrates useless or inherently harmful. They provide quick energy, support gut bacteria that ferment fiber, and supply nutrients in whole-food forms. But their non-essential status reveals something about metabolic priorities: the human body is metabolically equipped to thrive without them in a way it cannot thrive without fat or protein.
Consider what this means for the isotopic evidence. If carbohydrates aren’t metabolically required, the high animal-food consumption shown in bone chemistry doesn’t need plant foods to “complete” the diet in the way modern nutrition often assumes. Fat and protein were sufficient. Plants were opportunistic additions, not requirements.
This biochemical reality constrains dietary possibility space before examining any historical evidence. A diet dangerously low in fat or protein violates essential requirements. A diet low in carbohydrates does not.
The Energy Equation
Carbohydrates provide 4 calories per gram. Fat provides 9. Not opinion or trend, thermodynamic reality, measurable in any bomb calorimeter.
Humans aren’t bomb calorimeters. The simple measure of calories in and calories out doesn’t capture the full complexity of energy processing. But we do need to extract energy from food to survive, and caloric content provides a reliable, if incomplete, measure of that energy.
For a Paleolithic human expending 2,500–3,000 calories daily through hunting, foraging, and survival, this difference matters. A kilogram of beef fat yields 9,000 calories. A kilogram of tubers yields roughly 800. To obtain equivalent energy from plants requires harvesting, carrying, and often processing eleven times the mass.
Plant foods provide nutrients, variety, and resilience during scarcity. But basic energetic logic explains why, when available, fatty animal foods would be prioritized. Not from mystical ancestral wisdom, from thermodynamics.
The Metabolic Switch
The human body operates two primary metabolic modes, governed by the Randle cycle.
In glucose metabolism, insulin rises, signaling cells to burn sugar and store fat. In fat metabolism, insulin stays low, and cells preferentially oxidize fatty acids and ketones.
These modes compete. High glucose suppresses fat oxidation. High fat suppresses glucose oxidation. Not a design flaw. Efficiency. The body selects the most available fuel and downregulates the other pathway to avoid metabolic interference.
But here’s what makes humans unusual: unlike most mammals, we maintain robust ketogenic capacity. We can generate ketones sufficient to supply 60–70% of brain energy, something most animals cannot do efficiently.
Natural selection doesn’t preserve expensive metabolic machinery without cause. The simplest explanation is that our ancestors routinely operated in fat metabolism mode. Not occasionally during famine, but as a default state punctuated by carbohydrate availability.
These four constraints, protein ceiling, essential macronutrients, energy density, and metabolic architecture, narrow the possibility space before any archaeological evidence appears. They tell us what the human body can and cannot do, regardless of what anyone ate.
What Actually Happened
Biochemistry tells us what’s possible. History tells us what actually occurred. Bones don’t lie. They speak in a language of predictable numbers that transcends belief and narrative.
When an animal eats, stable isotopes from its food incorporate into its tissues. Different food sources leave characteristic signatures that remain readable long after death. Not interpretation. Measurement.
Unlike food recall surveys where participants misreport by 20–50%, bone chemistry can’t misremember its diet.
This is why isotopic analysis represents a fundamentally harder form of science than traditional nutritional epidemiology. Food frequency questionnaires depend on memory, honesty, and cultural bias. Controlled trials face the confounds we explored earlier. But isotopic ratios in bone collagen are physical facts, measured through mass spectrometry with precision that leaves little room for interpretation. The bone consumed what it consumed. The isotopes record it. The measurement reveals it.
The data comes from chemistry labs using standardized protocols. The mechanisms are well understood. The results are reproducible across laboratories worldwide. When we say Neanderthals show nitrogen-15 values of 10–12 parts per thousand, that’s not an estimate or extrapolation. It’s a direct measurement of what was physically present in their tissues when they died.
This objectivity matters because it bypasses the typical authority structures that have plagued nutritional science. You don’t need to trust a researcher’s funding source, study design, or statistical methods. You need to trust mass spectrometry, which operates on physical principles that don’t care about dietary ideology.
Two isotopes prove particularly useful. Nitrogen-15 reveals trophic level, where you sit in the food chain. Each step up enriches nitrogen-15 by approximately 3–4 parts per thousand. A value of 6‰ suggests herbivore. 9–10‰ suggests omnivore or secondary consumer. 12–14‰ suggests apex predator.
Carbon-13 distinguishes between plant types. Most trees, tubers, and temperate grasses use C3 photosynthesis. Tropical grasses and some sedges use C4. These pathways discriminate differently against carbon-13, creating distinct signatures. Marine foods show characteristic values too.
Together, these isotopes reconstruct not just what someone ate, but their position in the ecosystem.
Why use this instead of archaeological food remains? Because preserved bones vastly outnumber preserved meals, giving us data points across continents and millennia rather than isolated sites. And because bones integrate diet over years, smoothing out seasonal variation and capturing long-term patterns.
The Evidence
At Olduvai Gorge, Tanzania, Homo habilis remains from 2–3 million years ago show nitrogen-15 values of 8–10‰. Not herbivore values. Not even typical omnivore values. These are the signatures of animals consuming substantial quantities of other animals.
Accompanying stone tools show characteristic percussion marks, the type of controlled fracturing used to extract marrow from long bones. Why marrow specifically? It’s 70–80% fat, providing 9 calories per gram in a neat, packageable form. Early humans weren’t just hunting. They were targeting the fattiest tissues available.
Move forward to Neanderthals. Shanidar Cave, Iraq, 70,000 years ago: nitrogen-15 values of 10–12‰. Apex predator levels. Dental calculus, fossilized plaque, preserves plant microfossils showing cooked grains and tubers.
Neanderthals ate plants. But their isotopic signature indicates the bulk of their protein, and therefore their calories given the protein ceiling, came from animals. Specifically, from fatty animals like bison and aurochs.
At Vanguard Cave, Gibraltar, Neanderthal remains show even higher nitrogen-15 (12–14‰) with distinctive carbon-13 values indicating marine foods. These Neanderthals ate seals and large fish, some of the fattiest animals available.
Skip to Upper Paleolithic Homo sapiens at El Mirón, Spain, 50,000–10,000 years ago: nitrogen-15 of 9–11‰, with evidence of increased plant processing tools. Still high animal intake, but with more sophisticated plant use.
Then the Neolithic. At Çatalhöyük, Turkey, 10,000–5,000 years ago, carbon-13 values shift toward C4 plants, cereals. Nitrogen-15 drops to 8–10‰. Still substantial animal intake, but noticeably less than Paleolithic populations.
A pattern emerges across continents and climates: apex predator trophic levels for extended periods, then a gradual shift downward coinciding with agriculture.
Homo sapiens appears in the archaeological record around 300,000 years ago. For approximately 290,000 of those years, bone chemistry points to the same template: animal foods as foundation. Fat and protein. Plants as seasonal variables, grasses and roots, the occasional fruiting bush that shows up briefly, then disappears. Useful and opportunistic, not the anchor.
Agriculture arrives 10,000 to 15,000 years ago. The food environment flips fast. The wiring does not.
Agricultural diets are clearly possible. Humans obviously survived them. Some populations adapted. But survival is not the same as matched design.
What the record gives us is not a commandment. It gives us a baseline inside the corridor. A metabolic architecture shaped over deep time, then operated under predator-level intake for most of our time as modern humans. What came after is adjustment to new conditions, not a fundamental redesign.
The body you’re living in right now is still running the original base program.
The Exceptions
At Pinnacle Point, South Africa, 164,000 years ago, shell middens reveal systematic exploitation of coastal resources. These populations accessed a different fat source: fish oils rich in omega-3 fatty acids, seal blubber, and shellfish. Their isotopic signatures differ from terrestrial hunters, but they share a pattern: prioritization of the fattiest available foods.
Paranthropus boisei, the “Nutcracker Man,” shows carbon-13 values indicating heavy C4 plant consumption, likely from sedges and grasses. But Paranthropus wasn’t our ancestor. It was a contemporary hominin that took a different evolutionary path. It developed massive jaws and enormous grinding teeth. Homo developed larger brains and smaller guts. These are distinct adaptations to distinct diets.
Paranthropus represents an evolutionary dead end. Not as judgment, but as biological fact. The dietary strategy it pursued, while successful for a time, didn’t produce descendants that survived to the present. That lineage didn’t continue.
At Dolní Věstonice, Czech Republic, 30,000 years ago, archaeologists found evidence of seasonal dietary shifts. Summer: increased nut and plant remains. Winter: almost exclusive reliance on mammoth and reindeer, meaning heavy fat consumption when plant foods became unavailable.
This reveals metabolic flexibility, the ability to thrive on different fuel ratios within constraints. You can’t eat 60% protein. You need either fat or carbohydrates as primary fuel. The evidence suggests our ancestors regularly used both, but relied on fat more consistently.
What the Bones Show About Health
Isotopes tell us what people ate. Skeletons tell us how they fared.
Paleolithic skeletons show robust bone density, low dental caries, and minimal degenerative joint disease, at least among those who survived childhood and trauma. The Shanidar 1 Neanderthal lived to approximately 40–50 years despite severe injuries, showing bone remodeling and healing that indicates good nutrition.
Early Neolithic skeletons show increased dental wear from grinding grains, more caries from higher carbohydrate intake, and the first signs of deficiency diseases. Average height decreases. The same pattern appears later in ancient Egypt, where reliance on emmer wheat and barley led to widespread tooth decay and chronic infection, clear evidence of how agriculture’s gains came with biological costs.
Agriculture allowed population growth and civilization. But it represents a nutritional trade-off.
Modern hunter-gatherers provide living evidence. The Hadza of Tanzania show cardiovascular markers superior to industrial populations. The Inuit, consuming 70–80% calories from fat, primarily from seal blubber and fatty fish, historically showed low rates of heart disease and diabetes until Western diets arrived.
Metabolic Coherence
Biochemistry tells us what’s possible. History tells us what happened. Metabolism tells us why modern patterns create disease.
The Randle Cycle Revisited
Return to metabolic first principles. The Randle cycle describes how glucose and fatty acids compete for oxidation.
In a low-carb, high-fat diet, cells primarily burn fat. Insulin stays low. Fat oxidation runs efficiently.
In a low-fat, high-carb diet, cells primarily burn glucose. Insulin rises after meals but clears between them. This works fine if you’re insulin sensitive.
But in a high-fat, high-carb diet, you create metabolic confusion. Insulin rises from carbohydrates, signaling fat storage. Dietary fat provides substrate for that storage. The result is efficient fat accumulation, poor fat oxidation, rising triglycerides, insulin resistance.
This is the modern Western diet. Neither the high-fat pattern humans evolved eating nor the high-carb pattern some agricultural societies adapted to. It’s metabolically incoherent.
The Mismatch Pattern
If ancestral diets were fat-centric with variable plant intake, why does modern nutritional advice emphasize the opposite?
In 1961, Ancel Keys published his Seven Countries Study, showing correlation between saturated fat intake and heart disease. This became the foundation for decades of low-fat dietary recommendations.
But Keys’ study had problems. He selected 7 countries from 22 available, excluding those that didn’t fit his hypothesis. France, with high saturated fat intake and low heart disease, wasn’t included. Neither was Switzerland.
Follow-up studies told a more complex story. The 2010 meta-analysis by Siri-Tarino examining 21 studies with 347,747 participants found: “There is no significant evidence for concluding that dietary saturated fat is associated with an increased risk of CHD or CVD.”
The 2024 meta-analyses go further, distinguishing between saturated fat from whole foods (meat, dairy, eggs) versus processed sources like hydrogenated oils and processed meats. The former shows neutral or beneficial effects on cardiovascular markers when carbohydrates are reduced. The latter remains problematic.
Metabolic syndrome, the cluster of conditions including insulin resistance, obesity, high triglycerides, and hypertension, affects roughly a third of American adults. Its rise parallels not increased fat consumption, but increased refined carbohydrate and seed oil consumption.
Between 1961 and 2011, US dietary fat intake decreased from 45% to 34% of calories. Carbohydrate intake increased from 39% to 51%. Obesity rates tripled.
This correlation doesn’t prove causation. But it raises questions about whether we’ve been fighting the right enemy.
Individual Variance
The constraints get us out of fantasy. They eliminate what cannot work for humans, period. But once you’re inside the remaining corridor, something frustrating happens: multiple diets can appear to “work,” sometimes dramatically, and sometimes in opposite directions.
That isn’t proof that nutrition is unknowable. It’s proof that human variation is real enough to matter, and predictable enough to map. Within the same constraint boundaries, people differ in carbohydrate tolerance, dairy tolerance, fat handling, and microbiome response. The details below are not trivia. They are the reasons one person thrives on starch while another spirals, why one person can use dairy as a stable fat source and another can’t touch it, and why the same “clean diet” can feel calm in one gut and inflaming in another.
This is why diet wars never end. People are arguing from their own settings and assuming they are universal. The goal here isn’t to declare a winner. It’s to identify the handful of variables that reliably move the needle so you can stop guessing.
Lactase Persistence
Most mammals lose the ability to digest lactose after weaning. Most humans do too, except populations with pastoral ancestry, those whose recent ancestors herded dairy animals like cattle, sheep, and goats.
A mutation in the MCM6 gene, arising roughly 10,000 years ago in northern Europe and independently in East Africa, allows lactase production to continue into adulthood. Today, about 35% of humans retain this ability.
This represents rapid evolutionary adaptation to a new food source. For those with the mutation, dairy provides a valuable source of fat and protein. For those without, it causes digestive distress. The constraint is genetic and individual, not universal.
AMY1 Copy Number
Humans show variable copies of the AMY1 gene, which produces salivary amylase for starch digestion. Populations with long agricultural histories (East Asians, Europeans) average 6–7 copies. Populations with recent agricultural adoption (pastoralists, some hunter-gatherers) average 4–5 copies.
Higher copy number enables more efficient starch digestion. People with fewer copies may experience more rapid blood sugar spikes from starchy foods, suggesting they’d fare better on lower-carbohydrate approaches.
APOE and Fat Metabolism
The APOE gene comes in three common variants: E2, E3, E4. E3 is most common. E4, present in roughly 25% of people, increases Alzheimer’s risk and alters cholesterol response to dietary fat.
E4 carriers may need to emphasize unsaturated fats over saturated fats, particularly in the context of high total fat intake. This doesn’t invalidate the ancestral framework, but it requires individual calibration.
The Microbiome: Signal Distortion
Your gut bacteria determine how you extract nutrients from food, and they represent one of the most individualized aspects of human biology.
The microbiome operates as a metabolic organ. The bacteria in your colon ferment fiber that your own enzymes can’t digest, producing short-chain fatty acids (SCFAs) like butyrate, acetate, and propionate. These SCFAs fuel colonocytes, regulate inflammation, and influence everything from insulin sensitivity to mood regulation.
A disrupted gut environment increases sugar cravings and mood swings.
But microbial composition varies dramatically between individuals. The ratio of Firmicutes to Bacteroidetes, two dominant bacterial phyla, influences how efficiently you harvest energy from food. People with higher Firmicutes ratios extract more calories from the same meal, potentially advantageous during scarcity, problematic in abundance.
This composition isn’t fixed. It adapts to dietary input, but the adaptation takes time. Studies tracking microbiome shifts in response to dietary change show that significant remodeling requires 4–6 weeks minimum. Some changes happen faster. Within days, certain bacterial populations can expand or contract. But stable ecosystem-level shifts operate on a weeks-to-months timeline.
This explains a common pattern: someone tries a dietary change, feels worse initially, and abandons it within two weeks. The bloating, GI motility issues, electrolyte imbalance, and energy disruptions hit. They quit before their microbiome had time to adapt to the new fuel source. The initial discomfort wasn’t evidence the diet was wrong. It was evidence the ecosystem was remodeling.
Individual variation in baseline composition matters too. Someone with robust populations of butyrate-producing bacteria (like Faecalibacterium prausnitzii) may thrive on higher-fiber, moderate-carb approaches. Someone with a microbiome optimized for protein and fat metabolism may feel better on lower-carb patterns. The only way to know is direct observation over adequate time.
The microbiome also affects nutrient extraction beyond energy. Certain bacteria synthesize B vitamins. Others influence iron absorption, oxalate metabolism, and conversion of plant compounds into bioactive forms.
Two people eating identical diets may have dramatically different nutrient status depending on their microbial ecosystems.
This variability is why dietary experiments require patience and why the self-verification loop matters.
The constraints narrow the possibility space. You still can’t exceed the protein ceiling. You still need essential fats and amino acids. But within that space, your microbiome helps determine what works for you specifically.
The Self-Verification Loop
The constraints narrow possibility space. They eliminate options that violate biochemical limits, contradict historical evidence, or create metabolic incoherence. What remains must be verified through direct experience.
This means: if labs look optimal but you feel terrible, something’s wrong with the approach, even if the numbers say otherwise. If labs show “suboptimal” ranges but you feel amazing, your optimal may differ from population averages. If both labs and experience improve together, you’ve found something mechanistically real.
The body doesn’t lie about what’s working. The same principle that lets us read isotopes in ancient bones applies to reading signals in your own physiology. You just need to learn the language.
Consider tracking common biomarkers before a large dietary change and every 6–12 months: fasting glucose, HbA1c, hs-CRP for inflammation, and vitamin D. LDL significance is currently under scrutiny and debate, a poster child for contradictory messaging from the health attention economy. A lipid panel with particle size is another option if cholesterol is a concern.
Hyper Personalization
Embarking on a dietary change, especially from a typical Western diet, can be rocky. Your body has likely been building homeostasis detours, trying to adjust to the unfamiliar genetic demand of food abundance.
Use how you feel as primary guidance: energy stable throughout the day, mental clarity, sleep quality, normal hunger signals, digestive comfort, once you’re past the initial transition period.
A qualitative and quantitative analysis of the microbiome offers even more insight. A reliable food sensitivity test can reveal unique immune sensitivities. Continuous glucose monitors (CGMs) and other, less accurate wearables offer near real-time personal blood sugar reactions.
These external tools can help uncover misleading detours based on your epigenetics, how your body is responding right now, especially when embarking on a significant dietary change. Some bodies, in an attempt to adapt to decades of energy overwhelm, drift into unusual sensitivity to gluten, carbohydrates, or natural fats. Individual food sensitivities can misinform your signals during the first two weeks.
Expect any significant dietary change to be bumpy at first. As a rule of thumb, the transition is roughly a week of withdrawal symptoms followed by four or five weeks of microbiome adaptation. After the first few days, natural hunger signals start to return. Energy disturbances, GI discomfort, and mental clarity tend to recalibrate throughout the 4–6 week adaptation period.
The optimal diet for you makes you feel good, not just test good. But testing can catch problems before symptoms appear. Both matter. Neither is sufficient alone.
The constraints reveal a spectrum of what’s mechanically possible. Within that spectrum, some patterns align with biochemical limits, historical evidence, and metabolic coherence. Others don’t.
Next: where popular dietary approaches fall within this spectrum, and what happens when we examine Vegan to Carnivore patterns through the constraint lens.
Subscribe to get Part III, where we look at the metabolic coherence required to thrive, and why the high-carb, high-fat modern diet creates systemic confusion.
Nothing written here is meant to diagnose or treat. Educational purposes only.
References
Ben-Dor M, et al. (2021). The evolution of the human trophic level during the Pleistocene. American Journal of Physical Anthropology, 175(4), 27–56.
Cahill GF. (2006). Fuel metabolism in starvation. Annual Review of Nutrition, 26, 1–22.
Cerling TE, et al. (2011). Diet of Paranthropus boisei in East Africa. Proceedings of the National Academy of Sciences, 108(23), 9337–9341.
Henry AG, et al. (2012). The diet of early modern humans. Nature, 482(7386), 512–515.
Perry GH, et al. (2007). Diet and the evolution of human amylase gene copy number variation. Nature Genetics, 39(10), 1256–1260.
Phinney SD, et al. (1983). The human metabolic response to chronic ketosis without caloric restriction. Metabolism, 32(8), 769–776.
Randle PJ, et al. (1963). The glucose fatty-acid cycle. The Lancet, 1(7285), 785–789.
Richards MP, Trinkaus E. (2009). Isotopic evidence for the diets of European Neanderthals and early modern humans. Proceedings of the National Academy of Sciences, 106(38), 16034–16039.
Siri-Tarino PW, et al. (2010). Meta-analysis of prospective cohort studies evaluating the association of saturated fat with cardiovascular disease. American Journal of Clinical Nutrition, 91(3), 535–546.
Speth JD. (2010). The Paleoanthropology and Archaeology of Big-Game Hunting. Springer.
Volek JS, et al. (2009). Carbohydrate restriction has a more favorable impact on the metabolic syndrome than a low fat diet. Lipids, 44(4), 297–309.
Your bones don’t lie. They speak in a language of predictable isotopic numbers that reveal the human baseline.
Subscribe to get Part III, where we look at the Metabolic Coherence required to thrive, and why the high-carb/high-fat modern diet creates systemic confusion.
Nothing written here is meant to diagnose or treat. Educational purposes only.